The new way to monitor database activity in Firebird 2.5
Introduction
One disadvantage, which made it hard using Firebird in some circumstances, was a missing way to keep track of database operations continuously. A first step has been undertaken into this direction with Firebird 2.1 by adding the so-called monitoring tables. Firebird 2.5 goes much further now: The new Audit and Trace Services API allows tracing of server and database activity continuously. This article gives an introduction into the use of this new feature.
With the monitoring tables (MON$), introduced in Firebird 2.1, a user is able to query a point-in-time snapshot of the current database activities. For example:
- General information about a database, for example: file name, page size, ODS version, sweep interval, OIT, OAT, etc.
- Current established database connections with client information like IP address, client process name, etc.
- Overview on all transactions
- Overview on all SQL statements
- I/O- and record statistics at database-, connection-, transaction- and statement-level
Statements can be cancelled via the monitoring tables easily. It’s simply executing a DELETE FROM MON$STATEMENTS statement. This is especially useful when you have to abort a long-running query. In Firebird 2.5, two new monitoring tables MON$MEMORY_USAGE and MON$CONTEXT_VARIABLES have been added. Additionally, in 2.5 there is also a way to cancel an entire database connection/session and their transactions and statements. This is simply done by running a DELETE FROM MON$ATTACHMENTS statement.
Continuous Monitoring
To ensure a chronological sequence of database states for later analysis tasks, monitoring tables have to be queried periodically and the resulting data needs to be persisted somewhere. This can be done by using some kind of “versioning” of the monitoring tables’ content, as discussed on my blog [1]. There is some polling of the monitoring tables involved here, thus there will be still gaps in the database states audit trail, depending on the chosen request rate for querying the monitoring tables.
Prior 2.5, to continuously monitor a database, the user had to use third-party tools, which basically can be categorized as followed:
- Proxy application, which intercepts the TCP/IP network traffic between the client application and the Firebird server and decodes the Firebird remote protocol properly
- API-Call-Interceptor application, which intercepts the API calls of the client application to the Firebird client library
The brand new Audit and Trace Services API in Firebird 2.5 now finally allows – out-of-the box – creating a trace at statement-level with the following characteristics:
- Continuous
- Server-side
- Configurable
Some of the supported statements are:
- Connect/Disconnect
- Start/Commit/Rollback of transactions
- Prepare/Start/Finish/Free of SQL statements
- Start/Finish of stored procedures and triggers
Nevertheless, an audit/trace does not replace the monitoring tables, because with the monitoring tables, the user can query a snapshot of the current state of a database, whereas an audit/trace can be compared with a sequential stream of logged statements. Let’s try to answer the following question: “Give me the number of currently active transactions inside a database.” When using the monitoring tables, this simply can be accomplished by querying the MON$TRANSACTIONS table. With the audit/trace facility, this probably can only be done with advanced data analysis tasks on the log data stream (if at all). The following scenarios are common for an audit/trace:
- Number of executed statements in a particular time period
- Execution trace for an existing (third-party) application (black-box debugging)
- Is COMMIT RETAINING (soft commit) or COMMIT (hard commit) used by your application? With that information, possible performance problems can be examined
- Usage statistics for resource and load planning
- Logged statements as input for a security audit
- and more
Both, monitoring tables and the audit/trace approach in Firebird 2.5 also don’t replace a trigger-based DML audit mechanism, because in that case, changed data can be stored in a structured (old/new value) and queryable way, as with IB LogManager [2]. With Firebird 2.5, there are now at least three monitoring approaches available. They are compared in table 1.
| Trigger-based | Monitoring tables | Audit/Trace Services | |
|---|---|---|---|
| Available since Firebird version | 1.0 | 2.1 | 2.5 |
| Continuous logging | Yes | No | Yes |
| Serverside approach | Yes | Yes | Yes |
| Configurable | Yes | No | Yes |
| Monitoring of SELECT statements | No | Yes | Yes |
| Monitoring of DELETE, INSERT and UPDATE statements | Yes | Yes | Yes |
| Persisting of old/new column values for DELETE, INSERT and UPDATE statements | Yes | No | No |
| Storage of execution time | No | No | Yes |
| Storage of execution plan | No | No | Yes |
| Monitoring of database-wide operations like connect, disconnect, transaction start, transaction commit/rollback, prepare statement, free statement etc. | Partly (since 2.1 with database triggers) | Partly | Yes |
Driven by your monitoring requirements, you can choose one or a mixture of these approaches. In practice, the latter is used.
The remainder of the article will discuss the new Audit and Trace Services in more detail. Keep on reading!
System Audit vs. User Trace
Firebird 2.5 differs between a system audit and a user trace. A system audit will be started upon a Firebird Server start automatically. This means, there is no user interaction necessary. A new configuration parameter AuditTraceConfigFile in firebird.conf has been introduced, which holds the path to a trace configuration file. Is this parameter set/used (and the leading # removed), then the Firebird Server loads this file at start-up and initiate the start of a system audit based on the trace configuration found in the provided trace configuration file. The hereby available trace configuration parameters are discussed at a later point. In case of a system audit, trace data is stored in a text file in the file system of the server. On the other side, a user trace, as the name implies, needs to be started by a user explicitly. Hereby, the user needs to provide a trace configuration when starting a user trace session. Logged statements are stored at the server in a temporary file, until the initiating application fetches the trace data via the services API. A user trace does not stay alive when the Firebird server process gets restarted. A user trace needs to be started manually again.
An example says more than 1000 words
With the new command-line tool fbtracemgr, which can be found in the bin folder of your Firebird 2.5 installation, basic operations can be issued against the new Audit and Trace Services. This utility offers the following functionality:
- Start a user trace and receive/display the trace output from the server
- Terminate a trace session
- Suspend and resume a trace session
- List all currently available trace sessions
The following simple example shows the usage of fbtracemgr and how the trace output looks like. The trace configuration file includes the following lines:
<database employee.fdb>
 enabled true
 log_connections true
 log_transactions true
</database>
log_connections is one possible parameter (beside others, more on that later), which in particular logs connect/disconnect operations to/from a database called employee.fdb. Another parameter log_transactions activates logging of transaction-based operations like starting, committing and rolling back transactions. Important to notice, that the structure of the trace configuration file is the same for a system audit and a user trace. fbtracemgr can now be used, based on the given trace configuration, to start a user trace (my Firebird 2.5 server runs on port 3051).
The following all in a single command line:
fbtracemgr -se localhost/3051:service_mgr
  -user sysdba -password masterkey
  -start -name "User Trace 1"
  -config "fbtrace.conf" > trace.out
After a few client requests, the trace output looks like that:
Trace session ID 7 started
2009-12-29T11:57:37.4670 (2816:0148D81C) TRACE_INIT
        SESSION_7 User Trace 1

2009-12-29T11:57:37.4670 (2816:0148D81C) ATTACH_DATABASE
        employee.fdb (ATT_16, SYSDBA:NONE, TCPv4:127.0.0.1)
        C:\Program Files\Upscene Productions\Database
                              Workbench 3 Pro\DBW3.exe:4568

2009-12-29T11:57:37.4670 (2816:0148D81C) START_TRANSACTION
        employee.fdb (ATT_16, SYSDBA:NONE, TCPv4:127.0.0.1)
        C:\Program Files\Upscene Productions\Database
                              Workbench 3 Pro\DBW3.exe:4568
                (TRA_185, READ_COMMITTED | REC_VERSION | NOWAIT
                  | READ_ONLY)

2009-12-29T11:57:37.4830 (2816:0148D81C) START_TRANSACTION
        employee.fdb (ATT_16, SYSDBA:NONE, TCPv4:127.0.0.1)
        C:\Program Files\Upscene Productions\Database
                              Workbench 3 Pro\DBW3.exe:4568
                (TRA_186, READ_COMMITTED | REC_VERSION | NOWAIT
                  | READ_WRITE)

2009-12-29T11:57:37.5450 (2816:0148D81C) COMMIT_TRANSACTION
        employee.fdb (ATT_16, SYSDBA:NONE, TCPv4:127.0.0.1)
        C:\Program Files\Upscene Productions\Database
                              Workbench 3 Pro\DBW3.exe:4568
                (TRA_186, READ_COMMITTED | REC_VERSION | NOWAIT
                  | READ_WRITE)
     49 ms, 1 read(s), 1 write(s), 1 fetch(es), 1 mark(s)

2009-12-29T11:57:39.3730 (2816:0148D81C) COMMIT_TRANSACTION
        employee.fdb (ATT_16, SYSDBA:NONE, TCPv4:127.0.0.1)
        C:\Program Files\Upscene Productions\Database
                              Workbench 3 Pro\DBW3.exe:4568
                (TRA_185, READ_COMMITTED | REC_VERSION | NOWAIT
                  | READ_ONLY)
      0 ms

2009-12-29T11:57:39.3730 (2816:0148D81C) DETACH_DATABASE
        employee.fdb (ATT_16, SYSDBA:NONE, TCPv4:127.0.0.1)
        C:\Program Files\Upscene Productions\Database
                              Workbench 3 Pro\DBW3.exe:4568

2009-12-29T11:57:39.3730 (2816:0148D81C) TRACE_FINI
        SESSION_7 User Trace 1
As you can see, the trace output is simply text. In bold font you can see event types, e.g. ATTACH_DATABASE for a database connect/attach event. Each event type entry consists of a timestamp when the event happened, the process ID of the Firebird server process (in the example above: 2816), an internal trace number (0148D81C) to identify the trace session and the textual representation of the event. After that, event type specific data, e.g. the database name (employee.fdb), the attachment ID (ATT_<number>) and more is printed. Different event types can have different detailed data. For example, the START_TRANSACTION event type also includes information about the used isolation level (READ_COMMITTED) and more transaction-specific data.
Although this is easy readable for humans, it’s more complicated to parse the trace output, because we don’t have well-formed structured data like XML here. The structure of the data is implicitly defined by the included Firebird Trace-Plugin. To reverse engineer the structure of the trace output, it is necessary to study the source code of the trace-plugin and to make tests on what gets generated by the trace-plugin for certain event types. The trace engine in Firebird 2.5 is plugin-capable, so one could write a trace-plugin on its own, which generates easily-parsable trace data. Not an easy task though, because there is no documentation on how to write a customized trace-plugins available.
Firebird 2.5 comes with one trace-plugin as DLL or shared object file fbtrace(.dll|.so), which is located in the plugins sub-folder of a Firebird 2.5 installation. It implements the structure of the trace output as shown in the previous example above.
The Trace and Audit Services API also allows listing, stopping, suspending and resuming trace/audit sessions. Again, fbtracemgr can be used for these tasks. For example, the call for displaying all available trace sessions for a particular Firebird server instance looks like that:
fbtracemgr -se localhost/3051:service_mgr -user sysdba -password masterkey -list
With an example output:
Session ID: 7
  name:  User Trace 1
  user:  SYSDBA
  date:  2009-12-22 17:15:13
  flags: active, admin, trace
Here you can see what data is part of a trace session:
- Session ID: Is generated by the Firebird engine and starts with 1 once the Firebird server has been restarted
- name: Optional, not unique name of a session, which can be provided when starting a user trace session
- user: Name of the user, who has started the trace session
- date: Timestamp, when the trace session has been started
- flags: State (active, suspended), type (system audit, user trace)
More on the available command-line switches of fbtracemgr can be found in the Firebird 2.5 Release Notes.
Trace configuration
The trace configuration used above is kept very simple. There are quite some trace configuration parameters available. They are documented as comments in the sample fbtrace.conf file, pre-installed with each Firebird 2.5 distribution package. You should have a look into this file, because it possibly might serve as base for your own trace configurations.
Basically, a trace configuration can consist of a default section:
<database>
...
</database>

<services>
...
</services>
with global settings valid for each forthcoming database-specific section, which can be expressed by a regular expression (conform to the new Firebird 2.5 predicate SIMILAR TO) identifying the destination database(s), for example as used in the simple example in the previous section:
<database employee.fdb>
 ...
</database>
The various <database …> sections consist of the configuration parameters used to log actions at statement-level (e.g. prepare statement, execute statement, …), whereas the <services> section can occur only once, which allows to generate a trace of server-wide Services API calls like backup, restore, fetch header page, etc.
The trace configuration (file) gets read by the Firebird engine at start-up of an audit/trace, from top to bottom. Therefore, global parameters can be “overridden” by each database-specific section. An example:
<database>
        enabled true

</database>

<database employee.fdb>
        enabled false
        log_connections true
        log_transactions true
</database>

<database tourism.fdb>
        log_connections true
</database>
In this example, an audit/trace at database-level is activated globally, but will be deactivted for the particular employee.fdb entry. For the tourism.fdb entry, it isn’t necessary to set enabled to true again, as long as the global parameter doesn’t change and a trace should happen.
Table 2 lists the possible trace configuration parameters per section (database, services).
| Section | Parameter | Description | Values |
|---|---|---|---|
| database | enabled | Active / not active | true | false |
| include_filter | Trace SQL statements only, which satisfy the regular expression | String (regular expression) | |
| exclude_filter | Explicitly do not trace SQL statements, which satisfy the regular expression | String (regular expression) | |
| log_connections | Trace connect, disconnect operations | true | false | |
| connection_id | Enable trace for a particular attachment ID (CURRENT_CONNECTION) only. In case of 0, enabled for all attachments | Integer | |
| log_transactions | Trace of transaction operations (start, commit, rollback) | true | false | |
| log_statement_prepare | Trace, when a statement got prepared | true | false | |
| log_statement_free | Trace, when a statement got freed | true | false | |
| log_statement_start | Trace, when a statement got started | true | false | |
| log_statement_finish | Trace, when a statement finished its execution | true | false | |
| log_procedure_start | Trace, when a stored procedure got started | true | false | |
| log_procedure_finish | Trace, when execution of a stored procedure got finished | true | false | |
| log_trigger_start | Trace, when a trigger got started | true | false | |
| log_trigger_finish | Trace, when execution of a trigger got finished | true | false | |
| log_context | Trace, when a user-defined context variable got set via RDB$SET_CONTEXT | true | false | |
| print_plan | Output the execution plan | true | false | |
| print_perf | Output of detailed performance statistics | true | false | |
| log_blr_requests | Trace of BLR requests | true | false | |
| print_blr | Output the BLR text | true | false | |
| log_dyn_requests | Trace of DYN requests | true | false | |
| print_dyn | Output the DYN text | true | false | |
| time_threshold | *_finish parameter are traced, if execution time of the logged statement exceeds the value of this parameter | Integer (milliseconds) | |
| max_sql_length | Maximum length of printed SQL text. Rest will be truncated | Integer (characters) | |
| max_blr_length | Maximum length of printed BLR output. Rest will be truncated | Integer (characters) | |
| max_dyn_length | Maximum length of printed DYN output. Rest will be truncated | Integer (characters) | |
| max_arg_length | Maximum length of printed parameter names in case of parameterized statements | Integer (characters) | |
| max_arg_count | Maximum number of printed parameters in case of parameterized statements | Integer | |
| services | enabled | Active / not active | true | false |
| include_filter | Trace services events only, which satisfy the regular expression | String (regular expression) | |
| exclude_filter | Explicitly do not trace services events, which satisfy the regular expression | String (regular expression) | |
| log_services | Trace service manager attach/detach/start events | true | false | |
| log_service_query | Output the result of services requets | true | false |
Security
Every user can start and maintain trace sessions. The used user name at attach time to the services manager defines the applied privileges and visibility in respect to other registered trace sessions. Trace sessions, which have been started by SYSDBA, logs activities of all users/connections (as long as the connection_id parameter isn’t set in the trace configuration!). SYSDBA also has unrestricted access to all other trace sessions including system audit sessions to suspend, resume and stop trace sessions, even started by other users. If a non-SYSDBA (regular) user starts a trace session, then the trace session only sees “its” activity, which has been generated by the same user, compared with the user name used at connect time. Furthermore, a regular user also does not see trace sessions when fetching a list of available sessions and can’t suspend, resume and stop trace sessions, which have been started by others.
Access components support
If you are used to use e.g. the backup/restore functionality via the Services API, then there is good news. You also can use the audit and trace functionality in your own applications by using the new Services API calls properly. This can be done through the Firebird client library directly or by using specialized components/classes in your Firebird access component set, which will use the Services API behind the scene anyway. For that, your component set needs to support the following Services API calls:
- isc_action_svc_trace_start
- isc_action_svc_trace_stop
- isc_action_svc_trace_suspend
- isc_action_svc_trace_resume
- isc_action_svc_trace_list
Up to now, I’m only aware of two Delphi-based products, which have these calls implemented: IBObjects [3] with the freely available IBOAdmin package [4] and IBDAC [5]. Although, in case of the IBOAdmin package not in the publicly accessible SVN repository, but in my local development sandbox. If you are interested, just send me an email. The required extensions in the JDBC type 4 driver “Jaybird” are available in the HEAD branch. They might officially appear in one of the forthcoming Jaybird releases. Other products like FIBPlus [6] possibly already support the new Services API calls as well or might add them in later versions.
Firebird Trace Manager
The command-line utility fbtracemgr, which is included in each Firebird 2.5 distribution, offers a rudimental feature set for working with the new Audit and Trace Services. A new commercial product Firebird Trace Manager by Upscene Productions [7] will ease the use of the audit and trace facility in Firebird 2.5 dramatically. Let’s have a quick look on Firebird Trace Manager.
Figure 1: Firebird Trace Manager - Main Screen
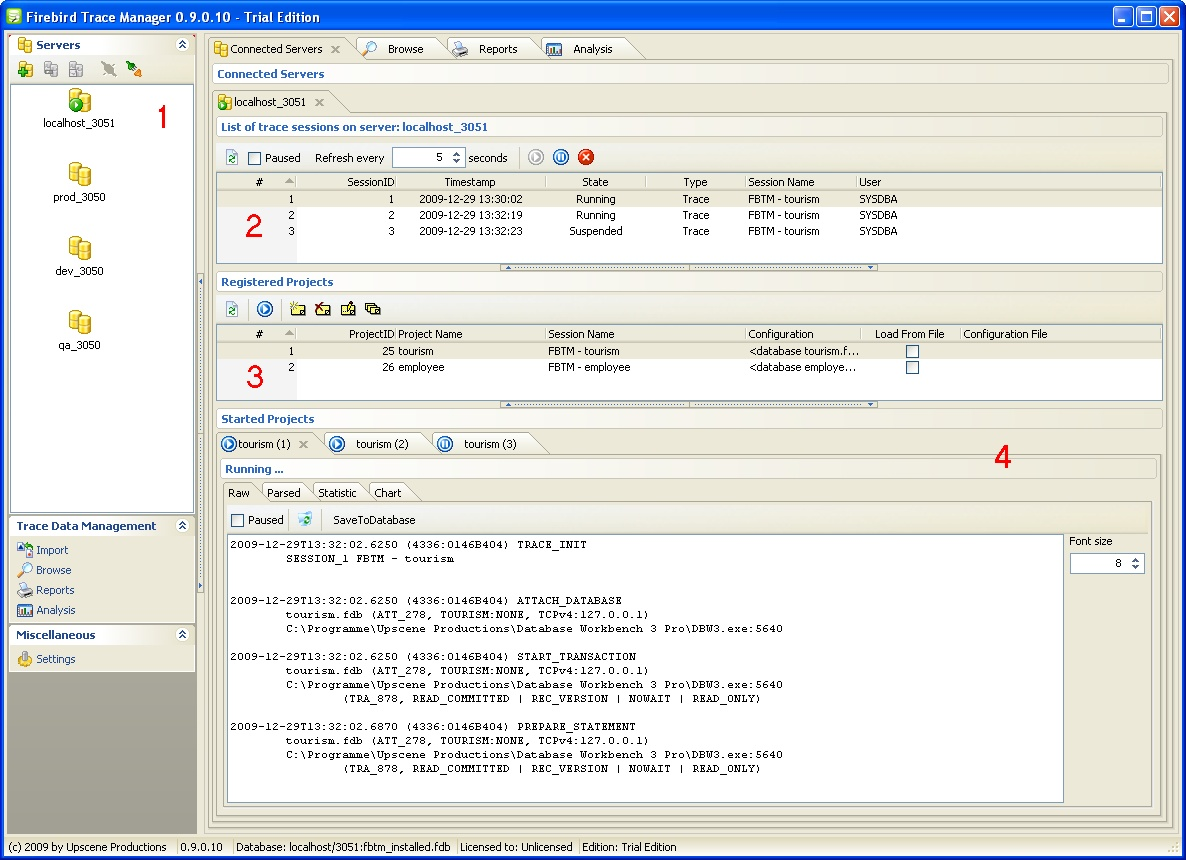
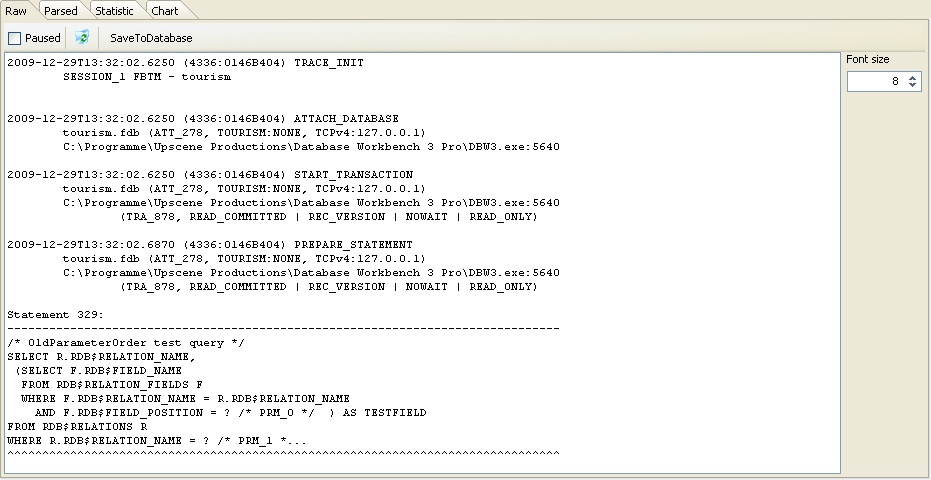
Figure 1 shows the main screen of the product. In the left area 1 there is a list of registered Firebird servers. A server entry allows the user to connect to the server via the Firebird services manager. In the right area, in the Connected Servers tab, you can see the current server attachments established by Firebird Trace Manager. Within a server attachment, in area 2, a list of trace sessions, including their states, is displayed. In this area, it’s very simple to suspend, resume and stop selected trace sessions. Per registered server, an unlimited number of projects can be created (area 3). A project basically defines the trace configuration as well as an optional trace session name. Based on a project entry, the user is able to start a new user trace session. Trace sessions started by Firebird Trace Manager are shown in area 4. Due to its multi-threading capabilities, Firebird Trace Manager can serve several trace sessions simultaneously, which includes receiving of “live” trace data and processing received data further. As with fbtracemgr, raw trace output will be received from the server (2).
Figure 2: Firebird Trace Manager - Received raw trace output
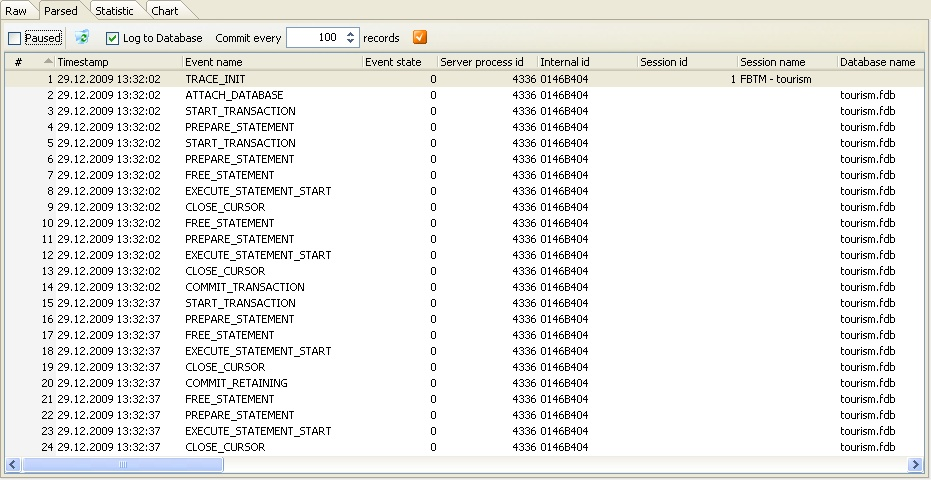
In a first step, raw data will be processed by a context-based parser to transform trace data into a structured form (3).
Figure 3: Firebird Trace Manager - Parsed trace output
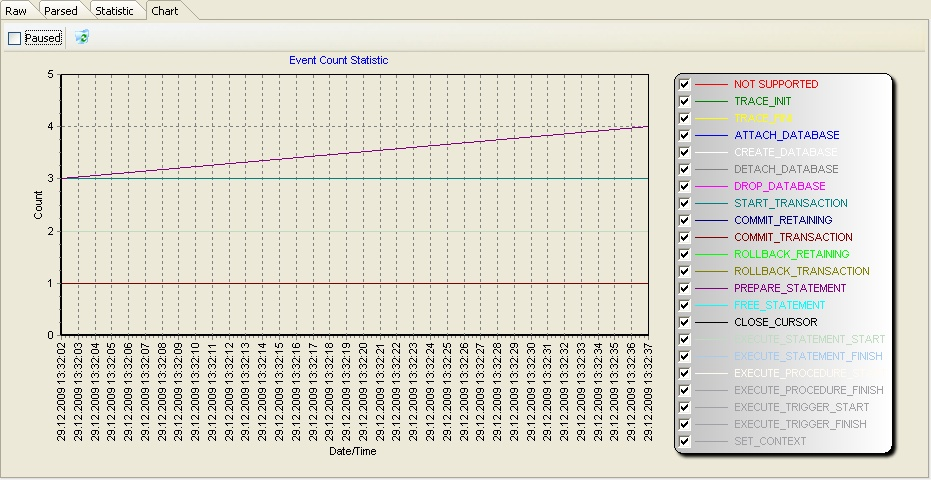
Optional, parsed/structured data can be stored in a pre-installed Firebird Trace Manager database for later analysis tasks. Further processing of parsed data includes visualizing statistics (4) and a frequency diagram (5) per event type.
Figure 4: Firebird Trace Manager – Event type statistic
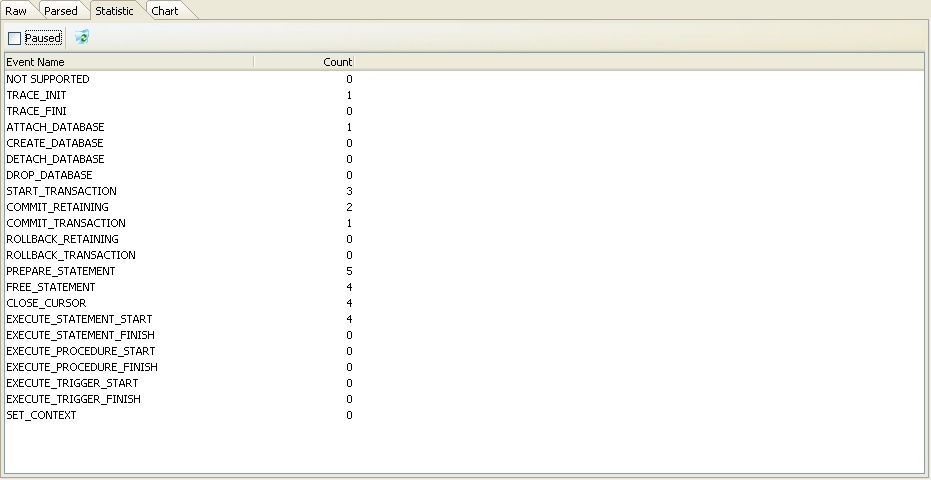
Figure 5: Firebird Trace Manager - Event type frequence diagram
The structured storage of trace data in the Firebird Trace Manager database enables further trace data processing. A module Browse allows accessing stored trace data easily. A module Reporting enables the user to create and execute new and pre-defined reports. The Analysis module can be used to answer OLAP/pivot-like questions, e.g.: “Number of events per year/quarter/month/day.” (6).
Figure 6: Firebird Trace Manager – Number of events per year/quarter/month/day analysis
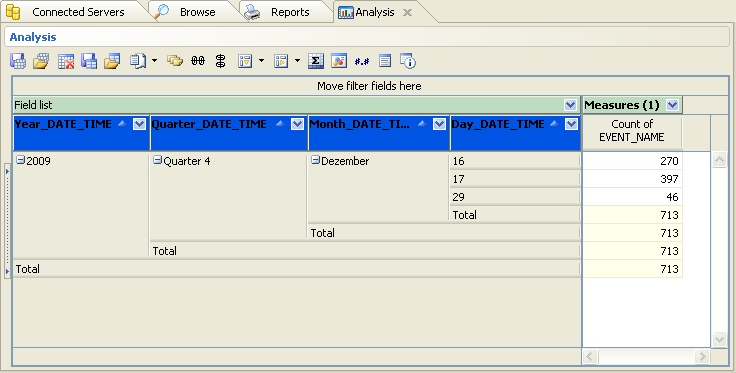
Due to the way the user can formulate ad-hoc queries in a visual way, the analysis capabilities are very powerful. The user can choose from a various number of attributes and aggregate functions, store queries and load/execute them at a later point, possibly on a different set of trace data.
Firebird Trace Manager is available in three different editions: Lite, Standard and Enterprise. The Lite Edition is freely available and basically is capable of receiving, storing and accessing raw trace data. Additionally, the Standard Edition includes the context-based parser, storage and access of structured/parsed trace data, as well as the Reporting module. The Enterprise Edition is the full-featured flavour of Firebird Trace Manager. Compared to Standard, it additionally includes the Analysis module and a planned – not in V1.0 available – facility to get automatically notified upon certain user-defined events.
Conclusion
Beside better SMP-capabilities in Firebird 2.5, the Audit and Trace Services API is possibly the second most important improvement. A continuous server-side trace has been long-awaited and now it’s available. Finally! In combination with the monitoring tables and a trigger-based DML-oriented mechanism, the Firebird project now has reached a good coverage in respect of monitoring Firebird databases.
Thomas Steinmaurer is an Industrial Researcher at the Software Competence Center Hagenberg [8] (Austria) in the area of data management and data warehousing specialized for the industrial manufacturing domain. Furthermore, he is responsible for the LogManager series (an auditing solution for various DBMS backends) and Firebird Trace Manager at Upscene Productions and was a co-founder of the Firebird Foundation [9]. The author can be reached at thomas.steinmaurer@scch.at or t.steinmaurer@upscene.com.
References
- [1] http://blog.upscene.com/thomas/index.php?entry=entry080730-135908
- [2] http://www.upscene.com/products.audit.iblm_main.php
- [3] http://www.ibobjects.com
- [4] https://ibobjects.svn.sourceforge.net/svnroot/ibobjects/trunk/iboadmin
- [5] http://www.devart.com/ibdac/
- [6] http://www.devrace.com/en/fibplus/
- [7] http://www.upscene.com
- [8] http://www.scch.at
- [9] https://firebirdsql.org/en/firebird-foundation/